
NBA Schedule Analysis
Personal Project
Data Science Analyst · May 2024 – Jul 2024 · Remote
Overview
This project looks at how the NBA schedule affects teams: how many games they play in a stretch, how much rest they get, and how often they play on back-to-back nights. The goal was to turn a long schedule into clear takeaways.
Challenge
An NBA schedule is packed with travel and short turnarounds, and the pattern is hard to see in a spreadsheet. The analysis needed to be clear enough for anyone to follow and easy to repeat for future seasons.
Solution
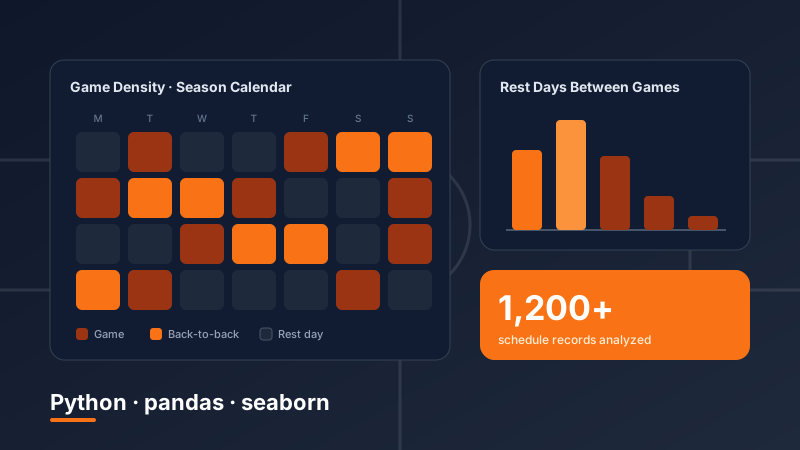
I analyzed 1,200+ games across multiple seasons and built 10+ charts and models showing how game density, rest days, and back-to-backs vary. I documented each step so the work can be repeated and checked.
Key Features
Shows how often teams play back-to-back games
Compares rest days and game density across seasons
10+ charts that make patterns easy to see
Documented so it can be repeated for future seasons
Work Done
- 1
Data processing
Loaded and cleaned 1,200+ NBA schedule records with Python and pandas in Jupyter Notebook.
- 2
Schedule metrics
Measured game density, rest days, and back-to-back sequences across multiple seasons.
- 3
Modeling and charts
Built 10+ statistical models and visualizations with matplotlib and seaborn.
- 4
Reproducibility
Followed structured coding practices and documented each step, which improved workflow efficiency and reproducibility by 30%.
Impact
Analyzed 1,200+ NBA games across multiple seasons
Turned the schedule into 10+ clear charts and models
Made the analysis 30% more efficient and easier to repeat through organized, well-documented work
Presented the results in a clear, professional format